
54% in 2015, not including veteran benefits. That brings the total to 60%.
From Beyond Nuclear
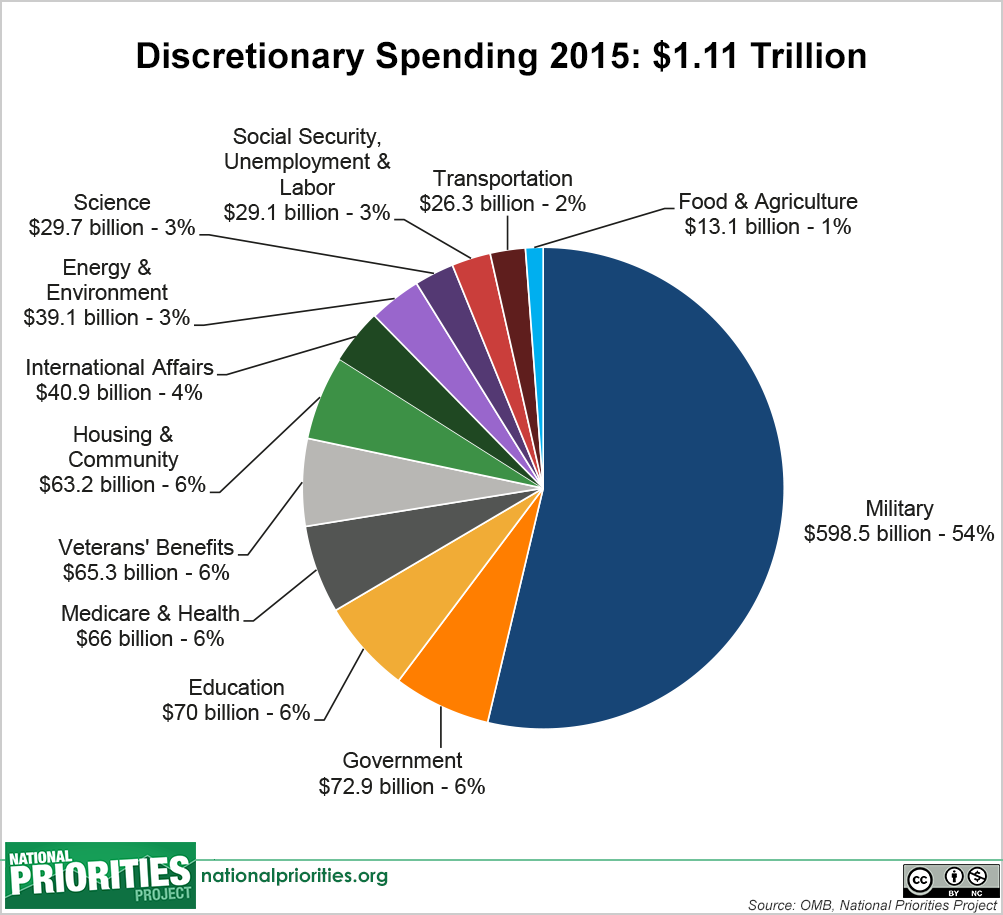
You may have seen this pie chart before. This shows how discretionary spending was allocated in Fiscal Year 2015. It never ceases to shock and appall. Every year, our Congress sets funding levels during the appropriations process. And every year, they slice off more than half the pie for military spending.
These are our tax dollars. But how many people really know how their money is spent? Please help spread the word. Download the chart from the National Priorities Project and distribute it widely.
No matter which issue is closest to your heart, it is hampered by this excessive spending on war-fighting instead of support for our struggling social services.
We must let our Congressional leaders know that we will not re-elect them if they continue to spend our tax dollars on war fighting! We have just under two years to get this message across before mid-term elections.
Human, civil and environmental rights are under siege in this country right now. They won’t be fixed unless funding is redirected from human destruction to human needs.
At Beyond Nuclear our focus is on eliminating spending on nuclear power and nuclear weapons. But as we can see in this chart, everything is connected. Drastically reducing military spending will raise all our boats…
